12/31/2010 - After doing couple of experiments on 5202 by similarity-based recommendation, I think the
best result is around 21%. So purely relying on this sort of method will not yield a result that is much
better than the current one.
To change the thinking pattern of solving the problem, I use latent factor model to take place of similarity-based
model in recommendation. In this model, the original User-Item matrix A (m x n, m = #users, n = #items, each column
of A is an item vector) is factorized into three sub matrices, namely, U, S, V. Where U is an m x r orthonormal
matrix (the user factors), S is an r x r diagonal matrix containing the singular values of A, V is an n x r orthonormal
matrix (the item factors). This is the so-called SVD factorization, i.e. A = U x S x VT. Then the prediction
is computed by computing the production of three objects: rui = ru x V x qiT.
However, the results of this model on 5202 is not good, even worse than the similarity-based model. It makes me to think about
the data - are the sub sets generated from the data good enough to verify our model? The data is generated by random strategy,
which means the distribution could not be controled by us. It may bias to some items.
Here are the hit rates for some different #factors (#factors <= r, in this case, r = 1004, the number of items) on site 5202,
Top-10 Recommendation:
#factors = 50, Hit Rate = 16.7%.
#factors = 60, Hit Rate = 18.3%.
#factors = 70, Hit Rate = 18.6%.
#factors = 80, Hit Rate = 17.3%.
#factors = 100, Hit Rate = 16.5%.
#factors = 150, Hit Rate = 15.8%.
#factors = 200, Hit Rate = 15.9%.
#factors = 500, Hit Rate = 6.7%.
12/27/2010 - I found that performing a power operation on similarity score, which reduces the differences
from the similarity measures, could yield a better result.
The Hit Rate is 21% (Site 5202, Top-10 Recommendation).
12/25/2010 - Based on the previous method, this approach eliminates the popularity-based score
and use a modified similarity model. There are two modifications: 1. For a user u, to predict
the probability that u will view an item i, I use the average similarity between i and its neighbors
that have been viewed by u rather than the highest similarity as the score. 2. use the popularity of
item i as the coefficient and apply it to the score to get the final recommendation score.
The Hit Rate is 20.5% (Site 5202, Top-10 Recommendation).
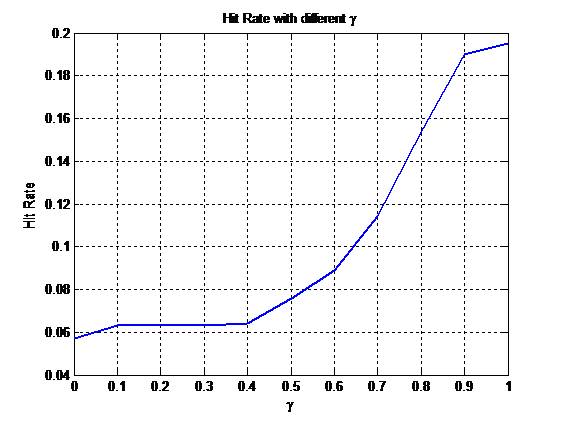
11/24/2010 - The predicted rating consists of two parts: the similarity of items
and the popularity of items. The experimental results show that the pure item
similarity-based recommendation performs better than the combined model.
The Hit Rate is 19.5% (Site 5202, Top-10 Recommendation).