
Here is a list of new features in the UK Edulab.
The following listed the items the monitoring function can offer. It also presented the results of one example experiment. You can get the NS file of the experiment through this link. Emulab uses the "NS" ("Network Simulator") format to describe network topologies. This is substantially the same Tcl-based format used by ns-2.Also, some testbed-specific syntax has been added, which with the inclusion of compatibility module (tb_compat.tcl), will be ignored by the NS simulator. The topology in this example experiment looks like the following:
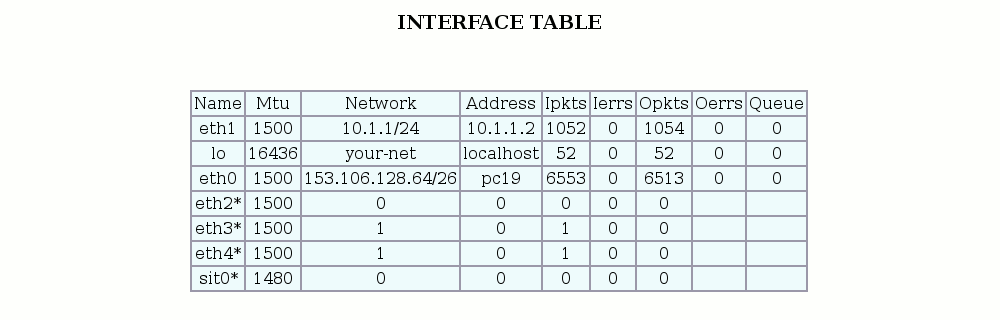
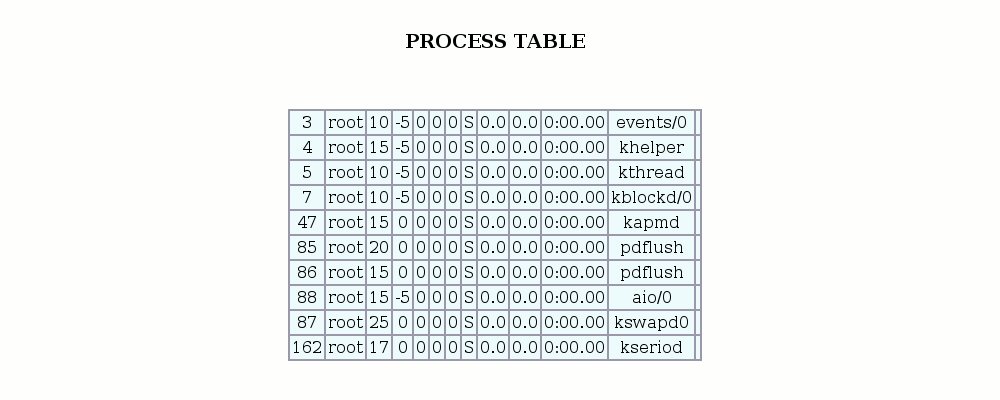
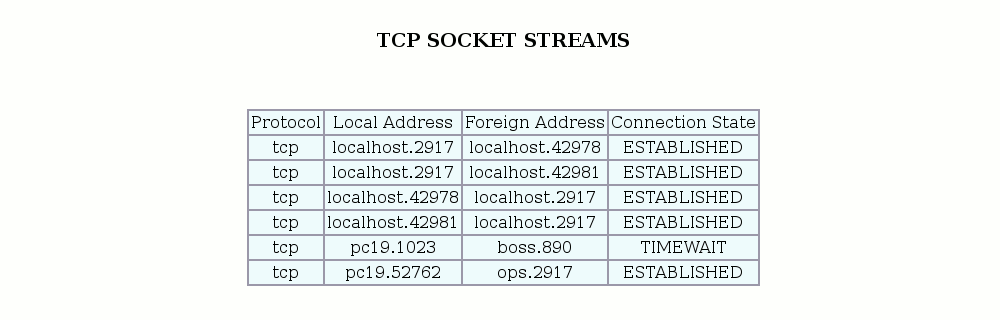
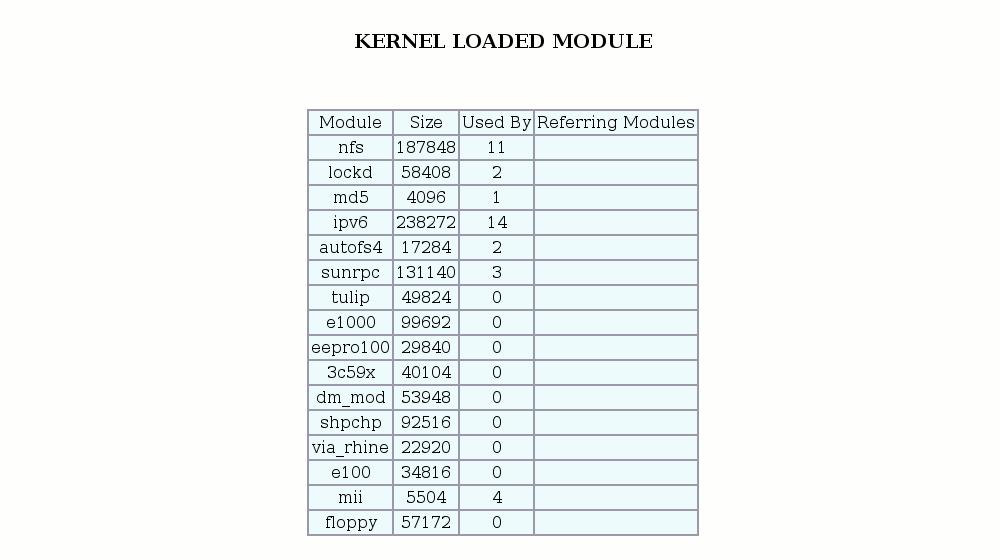
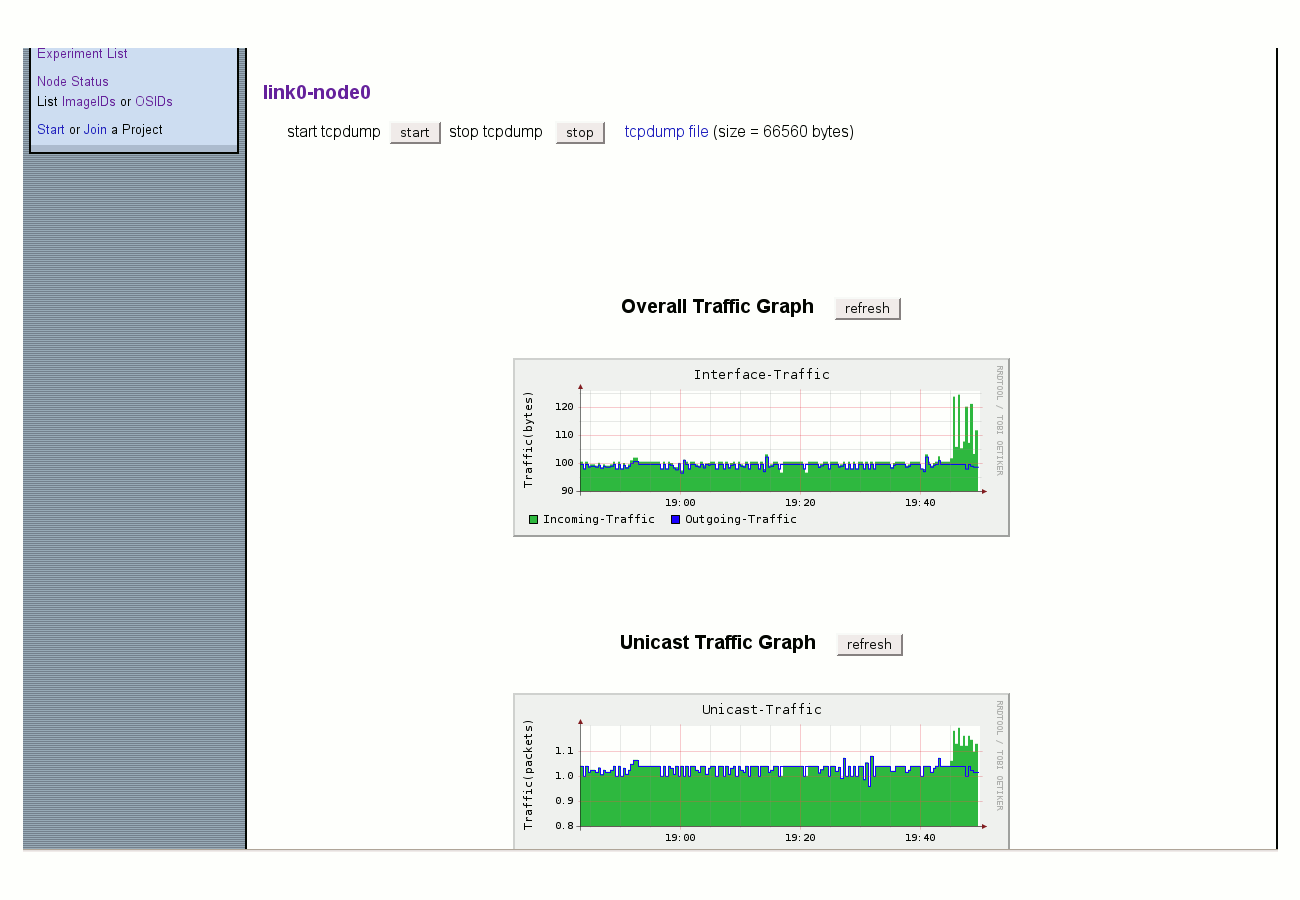
The following listed the statistic results of node0 in the example experiment which is under monitor.


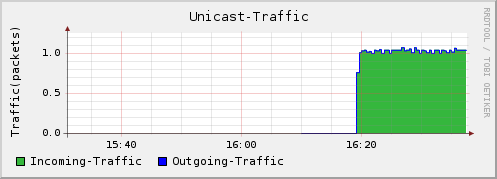
The following listed the statistic results of link0 from node0 to node1 in the example experiment which is under monitor.
This feature collected information of the students' system by project name(pid), experiment name(eid) and the time when the snapshot is taken. It dumped all the nodes' and links' information it monitored during the experiment and save the information as files in the directory of /usr/testbed/www/uky/snapshot/pid-eid-time on the server which is running Emulab. The information collected by this function is shown in the following table.
| Filename | Content |
|---|---|
| nodenameinterface.txt | interface table of the nodename specified |
| nodenameroute.txt | route table of the nodename specified |
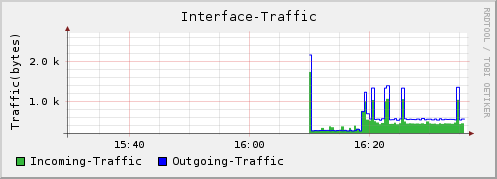
| nodenamep1.png | Overall Traffic Graph of the nodename specified |
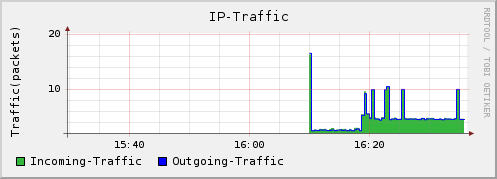
| nodenamep2.png | IP Traffic Graph of the nodename specified |
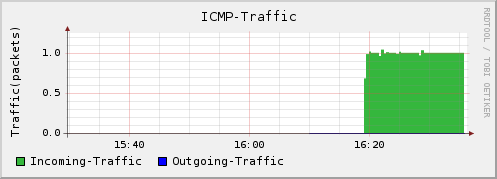
| nodenamep3.png | ICMP Traffic Graph of the nodename specified |
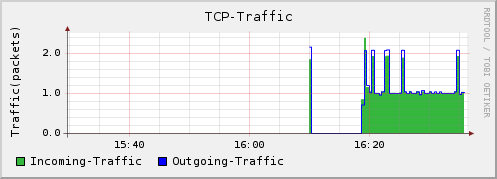
| nodenamep4.png | TCP Traffic Graph of the nodename specified |
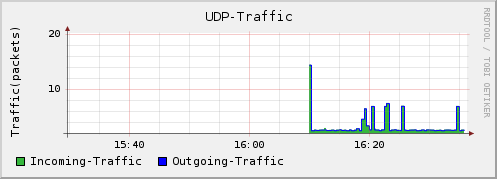
| nodenamep5.png | UDP Traffic Graph of the nodename specified |
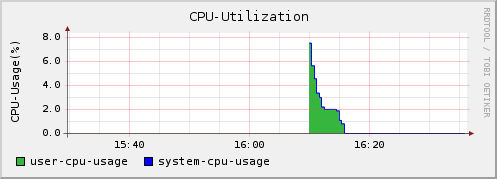
| nodenamep6.png | CPU Utilization Graph of the nodename specified |
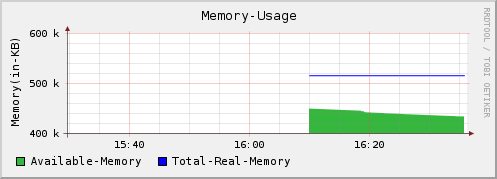
| nodenamep7.png | Memory Usage Graph of the nodename specified |
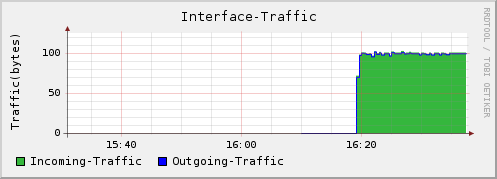
| linknamep1.png | Overall Traffic Graph of the link specified |
| linknamep2.png | Unicast Traffic Graph of the link specified |
The new feature of tcpdumping interface help students to track the propagation of traffic. This function is implemented at the switch via a monitoring port. The web interface of this function looks like the following:
The new feature of project scheduling allows faculty to cooperatively plan their project due dates to evenly distribute the load on the facility across the entire semester. The web interface of this function looks like the following:
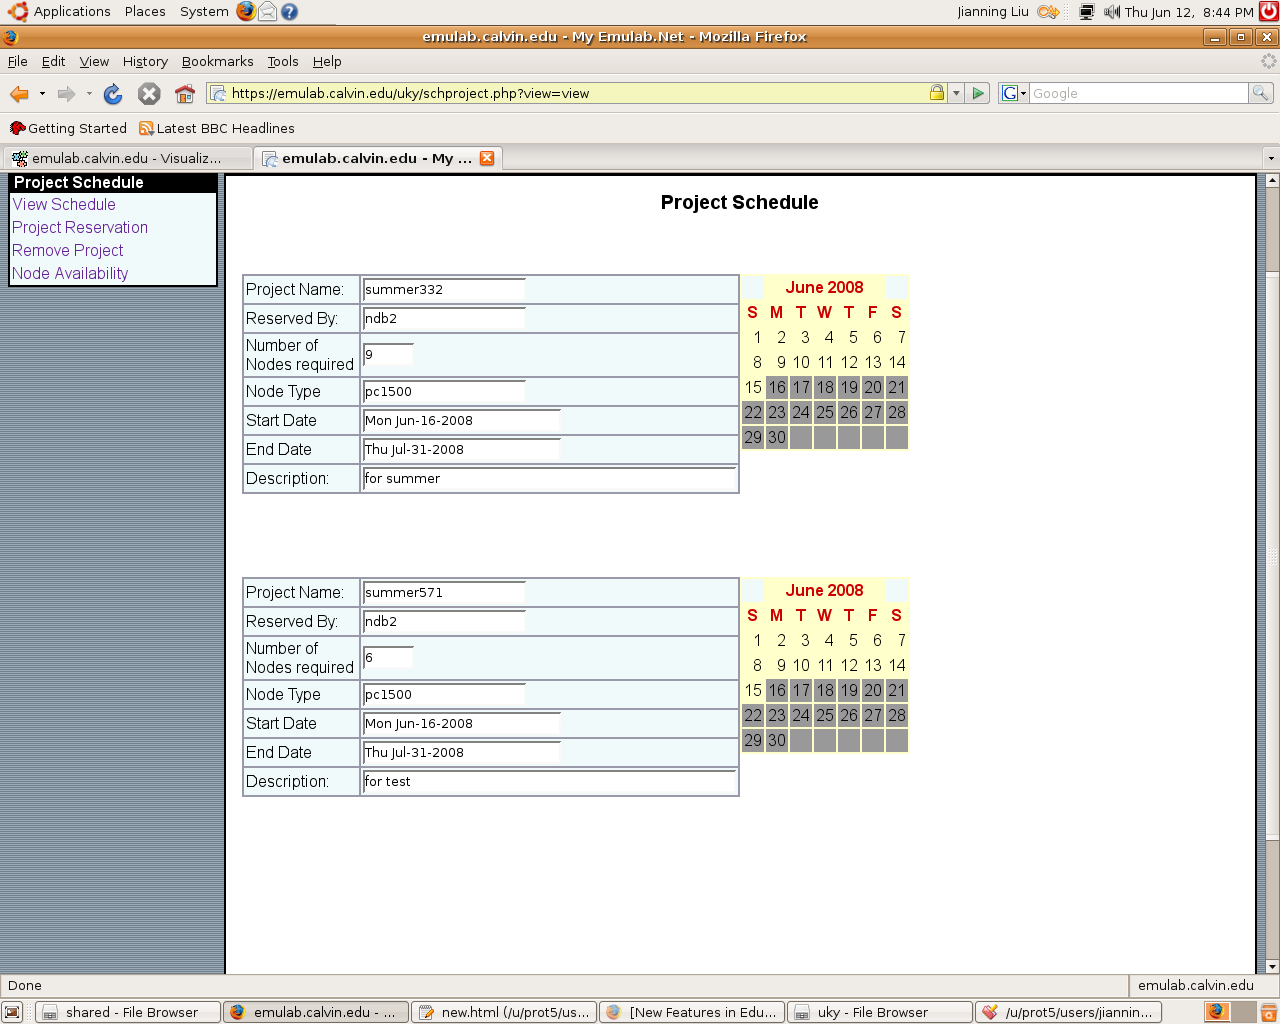
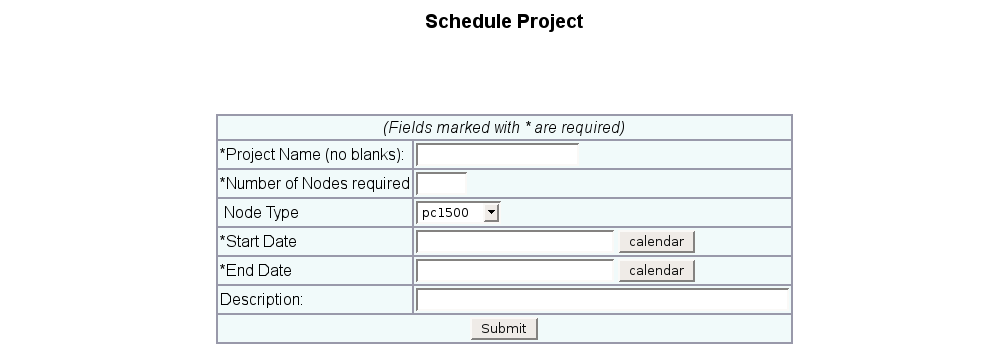
This is the view of project schedule. There is also an interface for faculty to reserve nodes for project. It is a form for faculty to determine how many nodes should be reserved for each project. The form looks like the following:
At the end of each semester, when the project is over, the faculty can remove the project by project name and start date. This function is implemented by a form on web page. The form looks like the following:

Also, the project schedule interface help faculty to check node availability, so that they can make good use of the facility across the entire semester. The function is implemented by a form on web page. The form looks like the following:

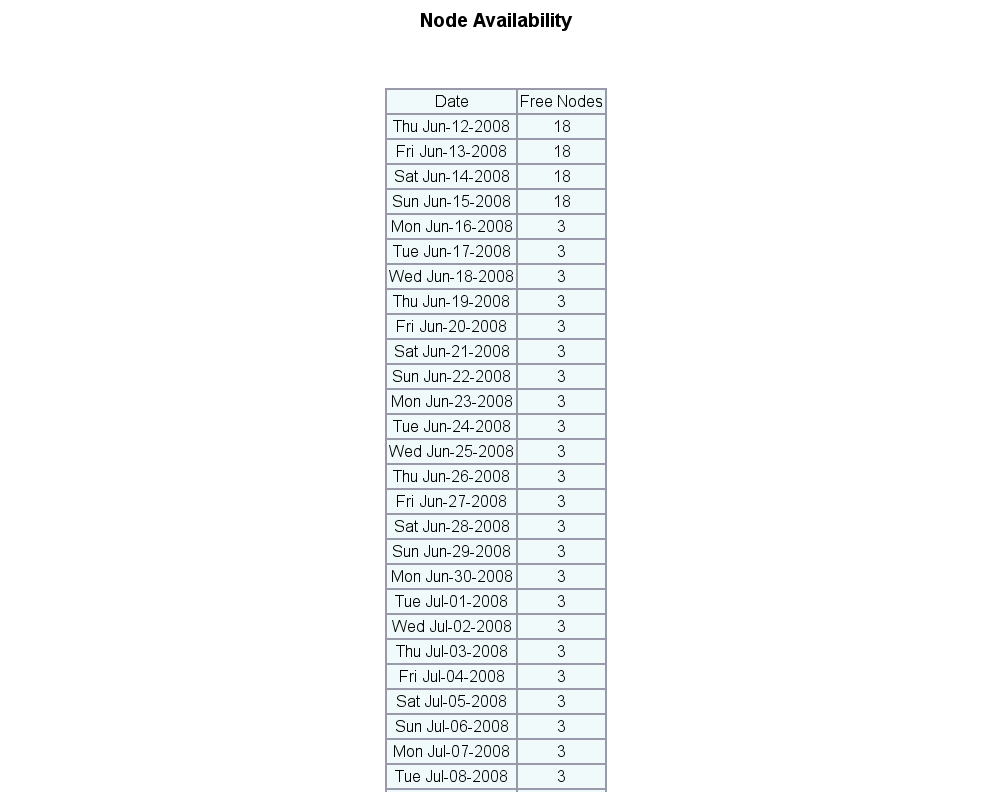
After submission for checking node availability, the faculty who issue this command can see a table like the following:
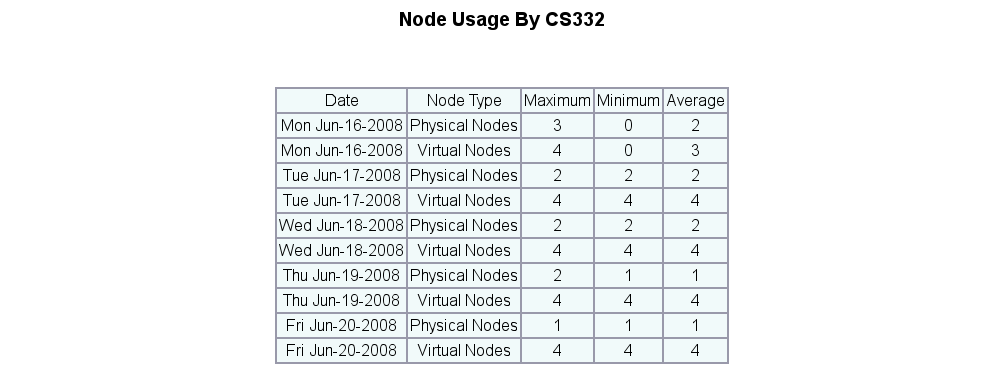
The new feature of usage report can show the results of how many nodes are used by each project, each group and each user during a certain time. The results are shown in a table like the following:
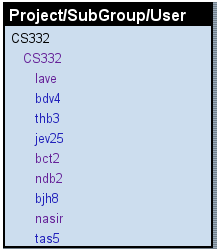
The directory for each level looks like the following:
The new feature of user management helps faculty or TA add users in batch. The web interface of this function looks like the following:
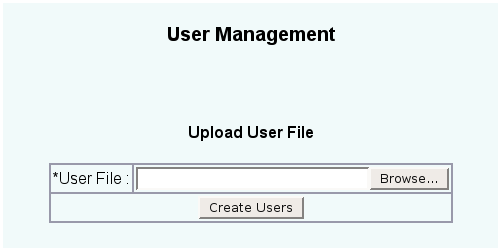
*User file should be comma separated values of following fields (for each user)::

User ID - Login name for the user, must be unique
User Name - Full name of the user
User Email ID - Mail id of the user
Project - Project in which user is added
Group - Group for the user
Trust - Trust level of the user (1:none,2:user,3:local_root,4:group_root,5:project:root)
After clicking on the "Create Users" button, the system will send the user an email by the User Email ID and a random password, so that the students can login the system by the User ID and the password.